Inspector Page
Shumate Inspector Page
Shumate adds a page to the GTK Inspector that allows you to toggle several debugging options.
The page only appears if the inspector is opened after the ShumateMap class has been initialized, so if you launch the application with GTK_DEBUG=interactive you may need to close and reopen the inspector.
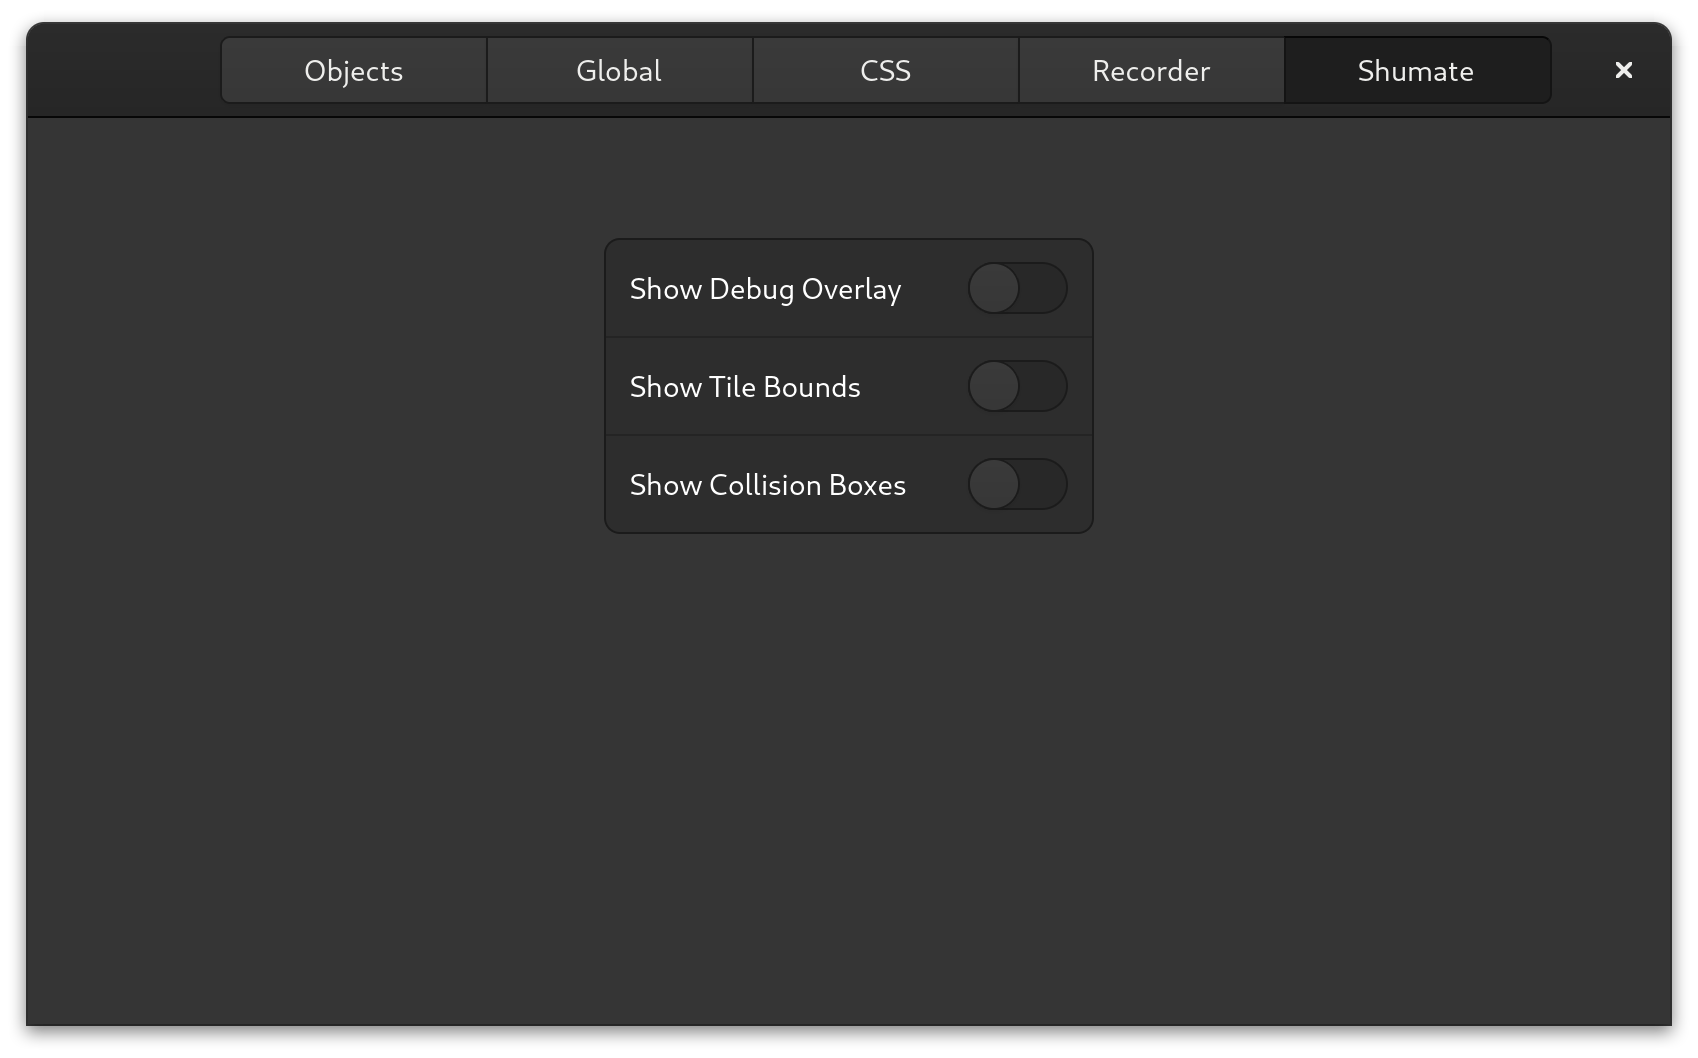
Show Debug Overlay
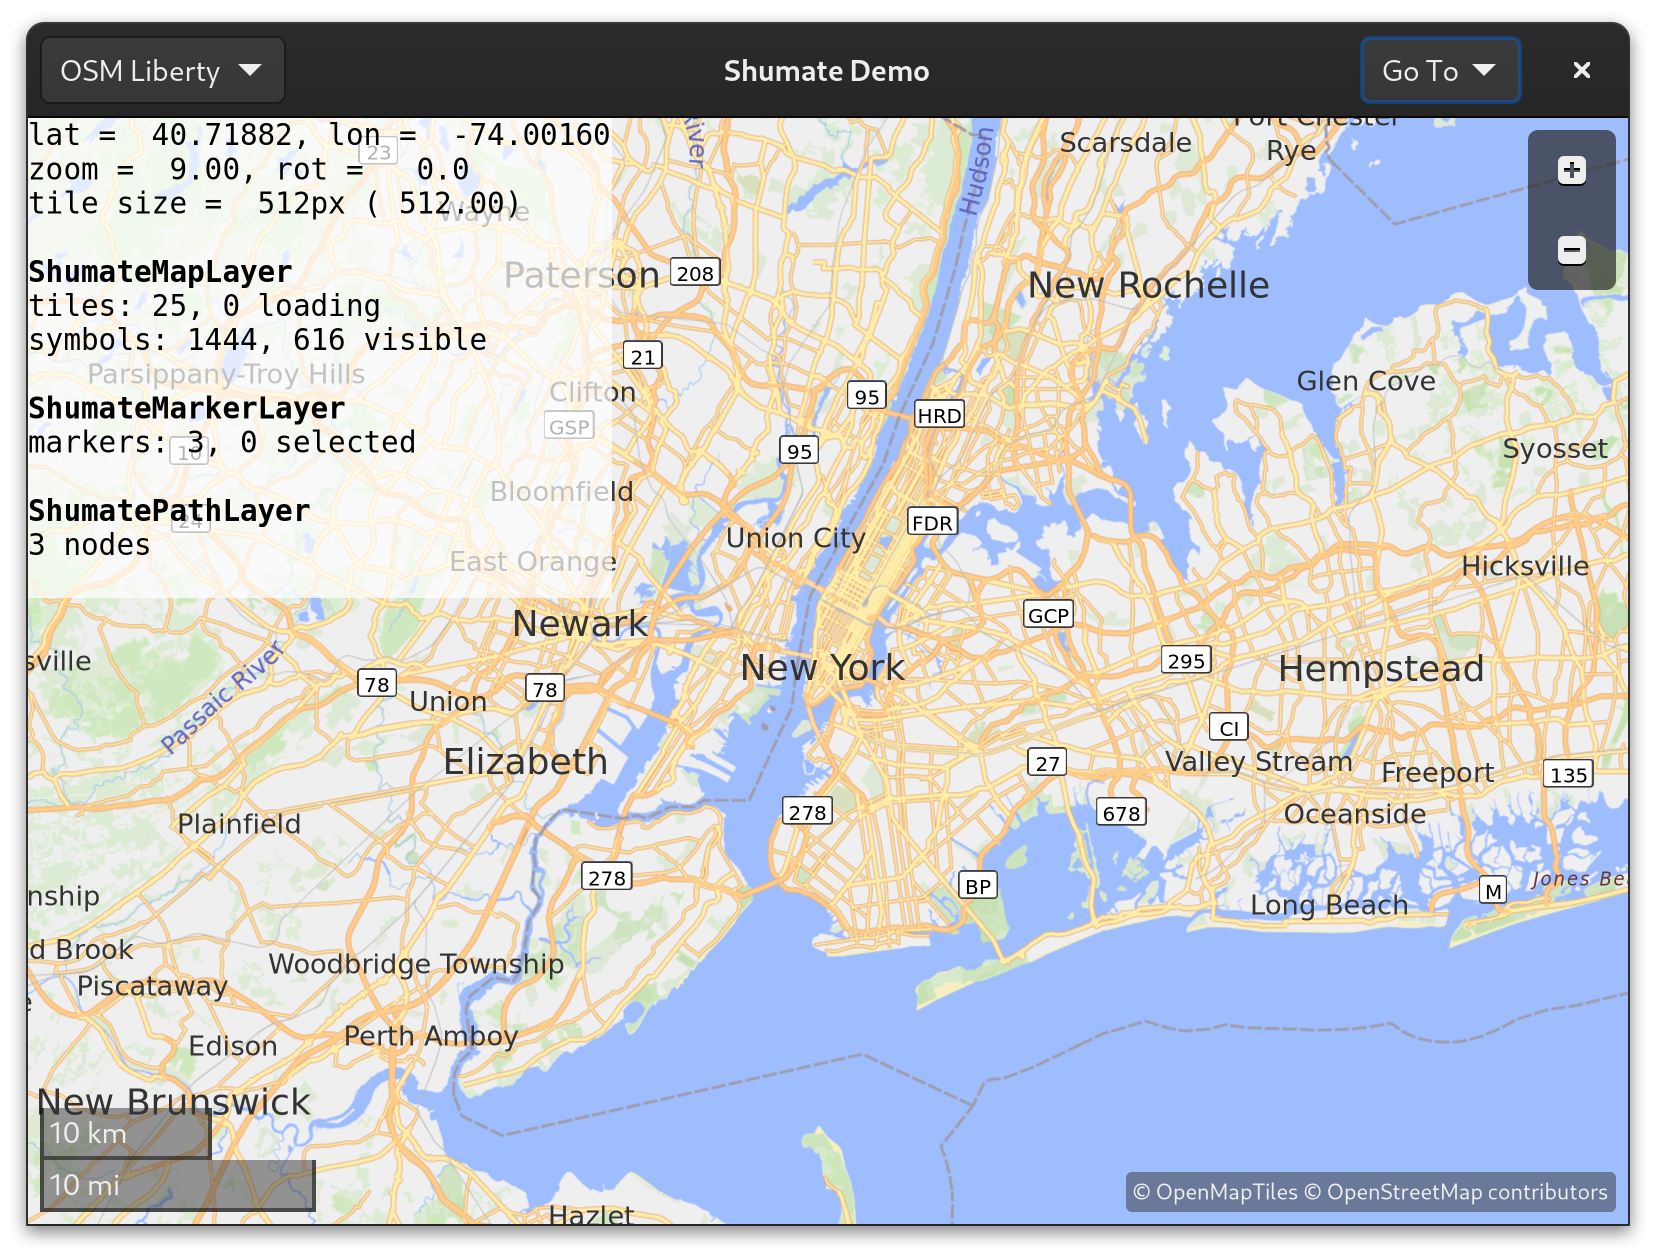
The debug overlay shows information about the viewport, tiles, and layers as an overlay over any Shumate map in the application.
Custom layer implementations can add their own debug information to the overlay by overriding Shumate.LayerClass.get_debug_text.
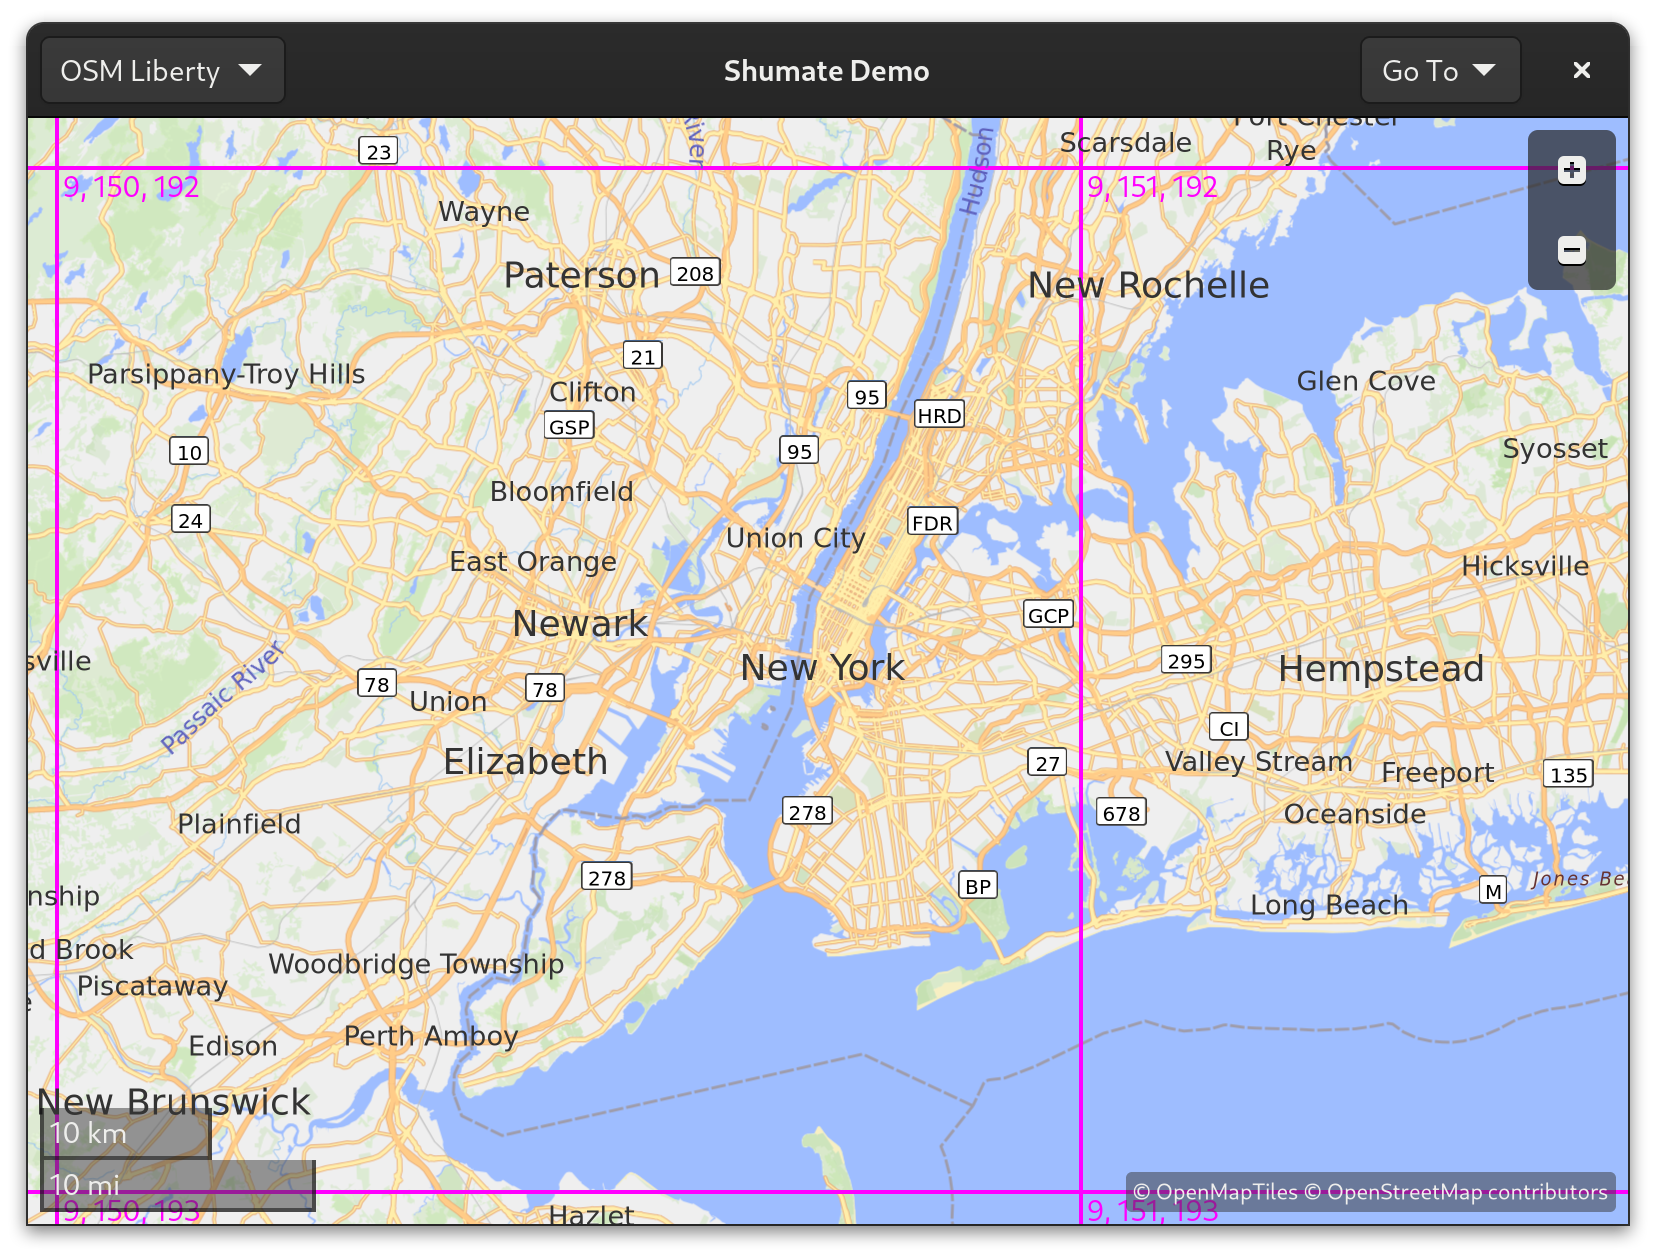
Show Tile Bounds
When enabled, the grid of tiles that make up the map is drawn with a magenta outline. Each tile’s coordinates are shown in the top left corner, in “Z, X, Y” order.
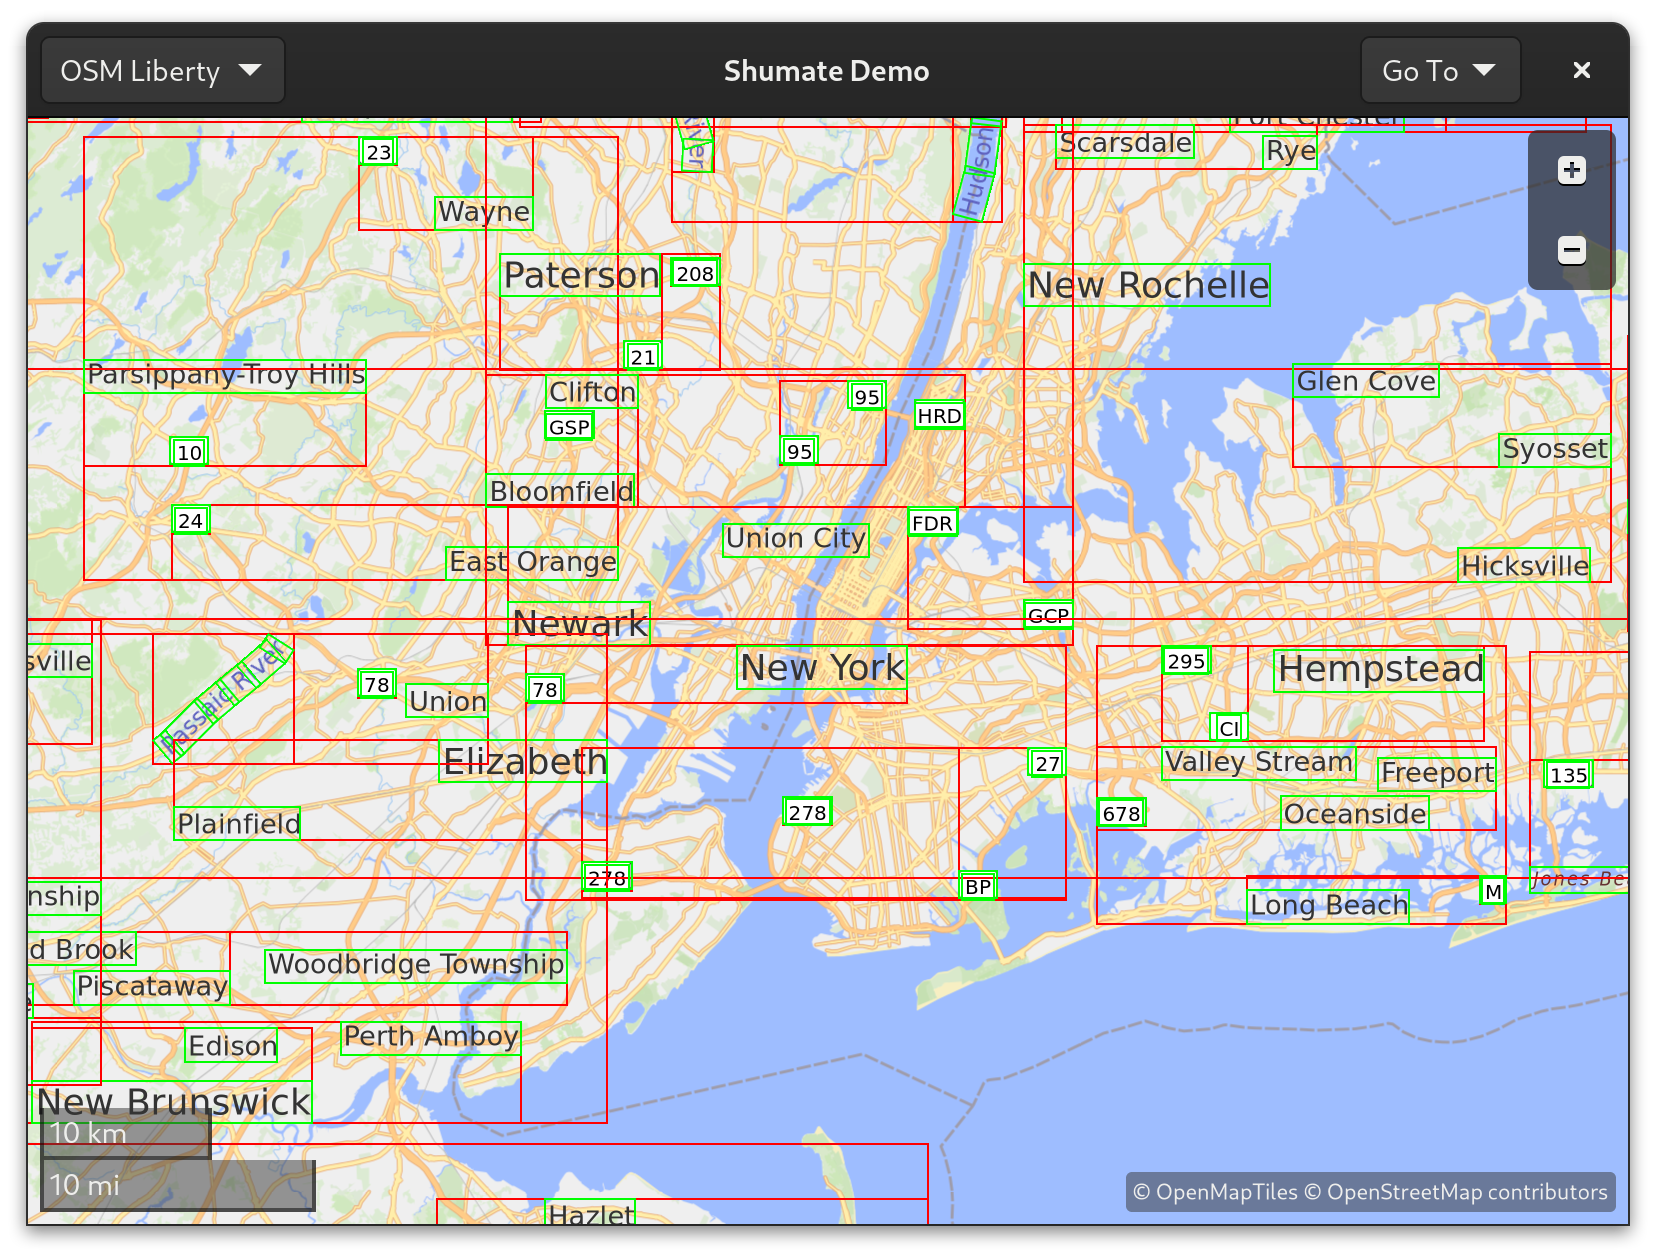
Show Collision Boxes
When enabled, collision boxes are drawn for all visible symbols. Individual boxes have green outlines, and the buckets of the internal R-tree structure have red outlines. This is useful for debugging symbol placement and overlap detection while developing libshumate itself.